
As of 2023, more than 2 billion people are shopping through e-commerce and there are over 24 million e-commerce websites globally.
In the previous year, shoppers contributed approximately $11.3 billion to Cyber Monday sales.
For the upcoming 2023 sales, it is anticipated that the figures will exceed the $13 billion mark.
Wondering how we arrived at this projection? Dive into the comprehensive analysis that informed our forecast. We meticulously studied past Cyber Monday data and incorporated the most recent trends expected to shape this year's sales.
Cyber Monday Data: Best Selections
- In 2023, Cyber Monday sales are expected to reach a revenue of $13.7 billion.
- The sales experienced a 5.8% growth in 2022, reaching a total revenue of $11.3 billion.
- On Cyber Monday, items in the United States had an average discount of 30%, while the rest of the world offered discounts ranging from 27% to 28%.
- A significant 77 million people participated in Cyber Monday shopping in 2022, with toys, electronics, and gift items being the most popular purchases.
- The average spending per shopper on Cyber Monday was $312 in 2022.
- Over the entire Cyber Week in 2022, consumers spent a total of $35.3 billion.
- The conversion rate on Cyber Monday was 6.9% for desktop users and 3.4% for mobile device users.
- E-commerce traffic on Cyber Monday increased by 2% in 2022, and 43% of the sales were conducted through mobile phones.
- Interestingly, the 'Buy Now, Pay Later' option saw an 88% increase in usage during Cyber Week.
- Paid searches accounted for 28% of the sales made on Cyber Monday.

Cyber Monday Sales
- In 2022, Cyber Monday sales saw a 5.8% increase compared to the previous year.
According to Adobe Analytics, the total sales on Cyber Monday reached $11.3 billion in 2022, which was 23.9% higher than the amount spent by shoppers on Black Friday in the same year.
- In 2022, initial forecasts predicted Cyber Monday sales to be $11.2 billion. Surpassing these projections, the actual sales amounted to $11.3 billion, exceeding the estimates by $100 million.
Cyber Monday contributed to around 5.34% of the total holiday shopping revenue in 2022.
Cyber Monday Shoppers
- During the 2022 Cyber Monday sales, 77 million individuals made online purchases.
- Shoppers were spending at a rate of $12.8 million per minute during peak hours, which occurred between 8 to 9 p.m.
- In addition, 22.6 million consumers opted for in-store shopping on Cyber Monday in 2022. Throughout Cyber Week, a total of 130.2 million people made online purchases, marking a 2% increase compared to the figures from 2021.
Cyber Monday Consumer Spending
- On Cyber Monday, the average shopper spent $146.75.
- Throughout Cyber Week, consumers collectively spent $35.3 billion, marking a 4% increase in spending compared to the previous year, as reported by Adobe.
- In 2022, consumer spending on toys surged by an impressive 684% compared to an average day.
- Toys became the most sought-after items on Cyber Monday, a trend expected to continue into the 2023 Cyber Monday sale. Additionally, other popular categories included electronics, computers, and sporting goods.
Cyber Monday Online Traffic
- In 2022, e-commerce traffic experienced a 2% growth during Cyber Monday sales, with peak activity attributed to increased discount rates.
- A significant majority, over 80% of US consumers, participated in Cyber Week shopping in 2022. Many shoppers were particularly drawn to Cyber Monday due to the substantial discounts offered on this occasion.
- The conversion rate for Cyber Monday stood at 6.9% among desktop users. Moreover, web traffic surged by 8% on Cyber Monday 2022 compared to the previous year.

Cyber Monday Mobile Shopping Statistics
Mobile e-commerce (m-commerce) constitutes a significant portion of the total retail e-commerce landscape, accounting for 70% of the entire online retail sales, totaling $3.4 trillion out of the $4.9 trillion in online retail sales.
Optimizing web stores for smartphones is crucial for businesses aiming for success in the e-commerce realm. Neglecting m-commerce means overlooking the vast majority of potential consumers. To emphasize this point, compiled m-commerce statistics are provided below to offer a clearer understanding of the market dynamics.
- Mobile devices constitute 70% of all visits to eCommerce sites.
- 7 out of 10 consumers make purchases from their smartphones, appreciating the time-saving aspect.
- Millennials use mobile devices for online deal comparisons 93% of the time.
- In physical stores, 65% of customers use smartphones to check price comparisons.
- Out of the $4.9 trillion in online retail sales, $3.4 trillion come from smartphones.
- After checking product details on smartphones in a physical store, 32% of shoppers change their purchasing decisions.
- Mobile app conversion rates are three times higher than mobile websites.
- The total value of mobile eCommerce sales in the UK is expected to exceed £80 billion in 2023.
- Bounce rates on Mcommerce websites increase by 32% when loading times increase from 1 to 3 seconds.
- Over 70% of online buyers prefer sites offering a smooth buying experience, increasing the likelihood of purchase.
- Customers with a poor mobile store experience are 62% less likely to return.
- In China, 64% of buyers prefer mobile payments over other methods.
- 70% of mobile searches result in a purchase within an hour.
- Adding Call to Action (CTA) buttons can boost clicks by 45%.
- Recommendations from friends significantly influence M-commerce purchasing decisions, more than emails and ad campaigns.
- 53% of mobile users prefer shopping from their favorite brand's apps.
- 61% of customers tend to shop on mobile websites that allow them to apply search filters.
Cyber Monday Marketing Tools
- Chatbot messages surged by 53% during the Cyber Monday sales in 2022.
- 81% of retailers participated in Cyber Monday sales in 2022. This percentage slightly decreased from 85% between Black Friday and Cyber Monday sales.
- Social media platforms redirected 12% of mobile traffic during the Holiday season, marking a 23% increase in social media referrals compared to the previous year.
- Paid searches were responsible for driving 28% of online sales.
During Cyber Monday 2022, paid searches emerged as the most significant sales driver, accounting for the majority of sales. In addition, 18% of sales were attributed to direct sales, while another 18% were directed through affiliate marketing efforts.
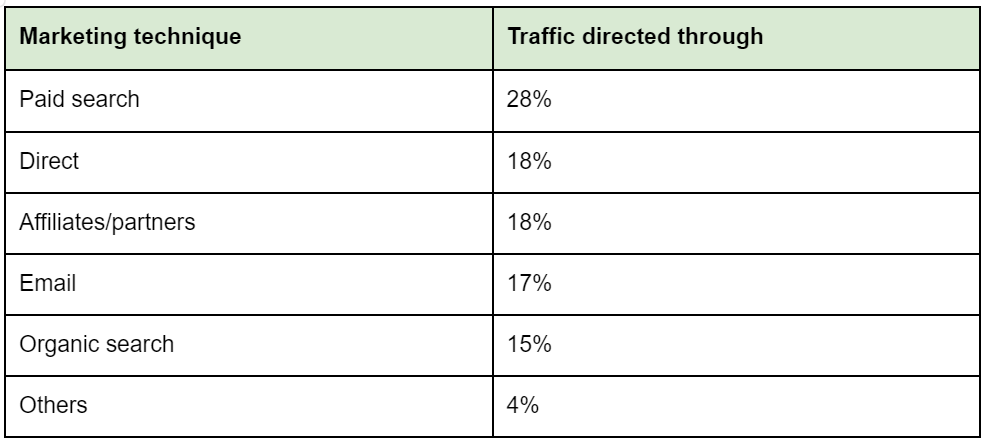
- Retailers' websites were the primary source where more shoppers learned about Cyber Monday 2022 deals.
- 88% of the top 50 retailers provide Cyber Monday discounts and deals.

About 45% of consumers found out about Cyber Monday sales through retailers' websites, while 41% learned about the deals through social media advertisements.
eCommerce Social Media Stats
- E-commerce stores with a social media presence generate 32% more sales.
- Short-form social media posts (<80 characters) have a 65.8% higher engagement rate.
- E-commerce websites create an average of five posts each week.
- Buyers referred by Instagram have the highest average order value at $65, followed by Facebook ($55), Twitter ($46), and YouTube ($38).
- Influencer marketing is expected to be worth $15 billion in 2023, making it essential for driving traffic to web stores.
- Businesses earn $6.50 on average for every $1 spent on influencer marketing campaigns.
- Nearly 75% of buyers rely on social media platforms to make purchasing decisions.
- 89% of marketers prefer Instagram for influencer marketing campaigns.
- Facebook accounts for 85% of e-commerce orders.
- Social media posts with pictures receive significantly higher engagement rates, with over 50% extra likes, 85% click-through rates (CTR), and more than 100% additional comments, highlighting the popularity of Instagram among marketers.
- Over 90% of businesses use social media to serve customers and provide post-sales services.
- Social media influences 55% of smartphone shoppers' purchasing decisions.
- Globally, 1.5 billion people use social media as a source of inspiration for their shopping.
eCommerce Growth Stats
Indeed, e-commerce has experienced exponential growth, especially during the COVID-19 pandemic. While the pandemic wave has subsided, e-commerce continues to thrive, indicating a sustained shift in consumer behavior. The following set of e-commerce growth statistics provides valuable insights into the trends and forecasts shaping the industry over the years.
- Worldwide e-commerce sales, currently at $4.9 trillion, are projected to reach $6.54 trillion in 2023, indicating significant growth in the industry.
- India is poised for exponential growth in the e-commerce sector in the coming years, highlighting the country's potential as a key market.
- Both the Philippines and India are leading the way in retail e-commerce sales, underscoring the rapid growth and adoption of online shopping in these countries.

- Turkey is anticipated to experience the highest Compound Annual Growth (CAG) in the retail e-commerce sector from 2020 to 2024, indicating significant advancement in the country's online retail market.
- The exponential growth of e-commerce is evident in predictions that it will constitute 95% of all retail purchases globally by 2040, highlighting the increasing dominance of online shopping in the retail landscape.
- E-commerce is expected to represent 24.5% of global retail sales, underlining its substantial share in the overall retail market.
Comparison between Black Friday and Cyber Monday
- Black Friday deals are available both online and offline, whereas Cyber Monday deals are exclusively dedicated to online discounts.
- In 2022, Cyber Monday online sales were 25% higher than Black Friday online sales, attributed to better deals and discounts offered by most online stores on Cyber Mondays. (Source: Practical Commerce)
- Consumers tend to spend 11.1% more on items like luxury and jewelry on Cyber Mondays compared to Black Fridays. In 2021, revenue generated on Cyber Monday surpassed that of Black Friday sales by 11.1%. Additionally, shoppers increase their spending on floral items and gifts by 63.9% during Cyber Monday.
Interesting Facts about Cyber Monday
Top-Selling Toys in 2022:
- Pokemon cards
- Hot Wheels
- Legos
- Disney Encanto merchandise
- CoComelon products
- LOL Surprise dolls
- Hatchimals
Top Playing Consoles in 2022:
- PlayStation 5
- Nintendo Switch
- Xbox Series X
- Top Games in 2022:
- FIFA 23
- Madden 23
- God of War Ragnarök
- NBA 2K23
- Pokémon Scarlet & Violet
Top-Selling Electronics on Cyber Monday 2022:
- Smart TVs
- MacBooks
- AirPods
- Tablets
- Instant Pots
- Air fryers
Shopping Trends:
- 81% of shoppers conducted online research before in-store shopping during Black Friday and Cyber Monday sales.
- Amazon experienced a significant boost in ad sales, with a notable increase of 146% during Cyber Monday.
About Cyber Monday & Sources
Cyber Monday refers to the online retail sales event that takes place on the Monday following Thanksgiving in the United States.Cyber Monday has evolved into the digital counterpart of Black Friday, providing smaller retail websites with an opportunity to compete against larger chains. Since its inception, it has gained international recognition and is now utilized by online retailers worldwide as a marketing strategy.
The statistics in this article come from a wide range of sources including Adobe Analytics, Demand Sage, Tech Crunch, Nielson IQ and STCLab. Each of these entities relies on distinct data sources, meaning that specific figures might vary in certain cases.